PROJECTS
PRODUCT DEVELOPMENT:
HomeMate App
Northeastern University,
Jan 2021 - Apr 2021
I D E A:
The app monitors the health of your appliances at home , notifies you about upcoming maintenance and connects you to the service professionals in the area.
P R O C E S S:
The Marketing Specification was framed first. The Canvas Business Model and Stakeholder Matrix was the next stage of progress.
The Idea was presented with a Promo Video and the Demo of the app using wireframing technique.
CHAT WITH ME TO KNOW MORE ABOUT IT !!!


Data Visualization:
World Happiness - Trends
Northeastern University,
Oct 2020 - Dec 2020
I D E A :
The World Happiness Report was visualized using various packages from R and the app demonstration was performed using R Shiny.
P R O C E S S :
The dataset contains information from 163 countries for years 2017,208 and 2019.
The dataset was cleaned and the plots were displayed in different tabs. The plots can be analyzed using Happiness rank, Economy, Population, Size of the nation and 6 other variables. It was interesting to find that Norway was continuously ranked first with a lower economy rate.
CHAT WITH ME TO DISCUSS ABOUT THE CODE AND OTHER IMPROVIZATIONS !!


Database Management:
E-Commerce - Distribution
Management
Northeastern University,
Oct 2020 - Dec 2020
I D E A:
Building the database using SQL Management Studio for E-commerce was the idea and focused on the chain of Clothing stores.
P R O C E S S:
The ER Diagram was designed using Microsoft Visio and normalized to the third degree and ensured we have unique attributes for every entity.
The initial database was then created and implementation of triggers, encryption, stored procedures were done to mimic a functional database in real time.
This database was analyzed using Power BI, where several relationships between prices and categories were picturized.
THERE ARE SO MANY THINGS TO TALK ABOUT THIS PROJECT !!


Project Management:
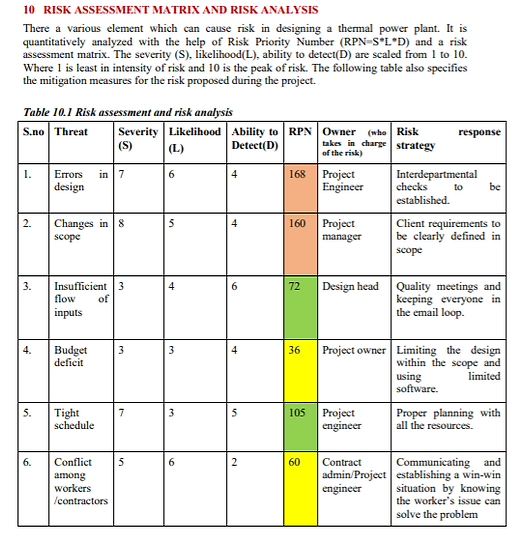
Design of Thermal Power Plant
Northeastern University,
Feb 2020 - 2020
I D E A:
The design report from the perspective of the Project Manager was prepared. It includes Scope definition, Project Roadmap, Budgeting, Work Breakdown Structure, Gantt Charts, Risk Assessment and Monitoring methods of Project.
P R O C E S S:
The progress of the work started from defining the Scope, the Market research of the area was done and then budgeting was fixed.
The Project had all the deliverables scheduled for each quarter that the design of the project was estimated to be complete in 15 months time.
Several network diagram using MS Visio and other charts using MS Project. Some of the interesting part of the project was framing the Monitoring and Control Measures.
CHAT WITH ME TO KNOW ABOUT IDEAS WHICH CAME UP IN THE LAST MOMENT !!
